Why The 3V’s Are Not Sufficient To Describe Big Data
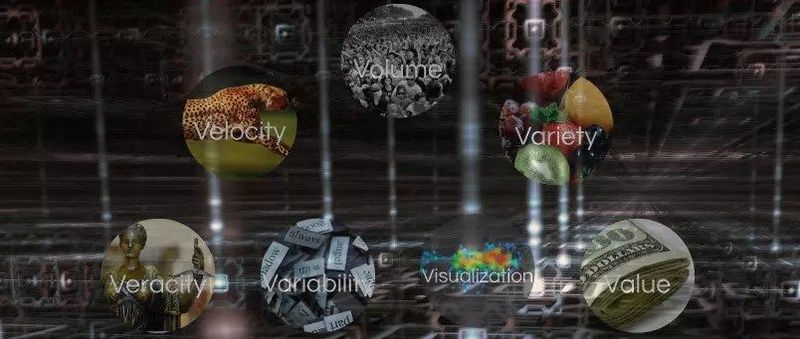
It is generally accepted that big data can be explained according to three V’s: Velocity, Variety and Volume. In a 2001 research report, META Group (now Gartner) analyst Doug Laney defined big data as being three-dimensional, i.e. increasing volume (amount of data), velocity (speed of data in and out), and variety (range of data types and sources). Later in 2012 Gartner updated the definition of big data as high volume, high velocity, high variety. Although I do not want to diminish the importance of the definition by Gartner, I do think that big data can be better explained by adding a few more V’s. These V’s explain important aspects of big data and a big data strategy that organisation cannot ignore. Let’s look at these V’s and for completeness, let’s also once more mention the common known V’s:
Velocity
The Velocity is the speed at which the data is created, stored, analysed and visualized. In the past, when batch processing was common practice, it was normal to receive an update from the database every night or even every week. Computers and servers required substantial time to process the data and update the databases. In the big data era, data is created in real-time or near real-time. With the availability of Internet connected devices, wireless or wired, machines and devices can pass-on their data the moment it is created.
The speed at which data is created currently is almost unimaginable: Every minute we upload 100 hours of video on Youtube. In addition, every minute over 200 million emails are sent, around 20 million photos are viewed and 30.000 uploaded on Flickr, almost 300.000 tweets are sent and almost 2,5 million queries on Google are performed.
The challenge organisations have is to cope with the enormous speed the data is created and used in real-time.
Volume
90% of all data ever created, was created in the past 2 years. From now on, the amount of data in the world will double every two years. By 2020, we will have 50 times the amount of data as that we had in 2011. The sheer volume of the data is enormous and a very large contributor to the ever expanding digital universe is the Internet of Things with sensors all over the world in all devices creating data every second. The era of a trillion sensors is upon us.
If we look at airplanes they generate approximately 2,5 billion Terabyte of data each year from the sensors installed in the engines. Self-driving cars will generate 2 Petabyte of data every year. Also the agricultural industry generates massive amounts of data with sensors installed in tractors. Shell uses super-sensitive sensors to find additional oil in wells and if they install these sensors at all 10.000 wells they will collect approximately 10 Exabyte of data annually. That again is absolutely nothing if we compare it to the Square Kilometer Array Telescope that will generate 1 Exabyte of data per day.
In the past, the creation of so much data would have caused serious problems. Nowadays, with decreasing storage costs, better storage solutions like Hadoop and the algorithms to create meaning from all that data this is not a problem at all.
Variety
In the past, all data that was created was structured data, it neatly fitted in columns and rows but those days are over. Nowadays, 90% of the data that is generated by organisation is unstructured data. Data today comes in many different formats: structured data, semi-structured data, unstructured data and even complex structured data. The wide variety of data requires a different approach as well as different techniques to store all raw data.
There are many different types of data and each of those types of data require different types of analyses or different tools to use. Social media like Facebook posts or Tweets can give different insights, such as sentiment analysis on your brand, while sensory data will give you information about how a product is used and what the mistakes are.
Are you looking for Big Data Jobs or Candidates? Please go to our WORK section
The Four Additional V’s
Now that the context is set regarding the traditional V’s, let’s see which other V’s are important for organisations to keep in mind when they develop a big data strategy.
Veracity
Having a lot of data in different volumes coming in at high speed is worthless if that data is incorrect. Incorrect data can cause a lot of problems for organisations as well as for consumers. Therefore, organisations need to ensure that the data is correct as well as the analyses performed on the data are correct. Especially in automated decision-making, where no human is involved anymore, you need to be sure that both the data and the analyses are correct.
If you want your organisation to become information-centric, you should be able to trust that data as well as the analyses. accountability.
Variability
Big data is extremely variable. Brian Hopkins, a Forrester principal analyst, defines variability as the “variance in meaning, in lexicon”. He refers to the supercomputer Watson who won Jeopardy. The supercomputer had to “dissect an answer into its meaning and […] to figure out what the right question was”. That is extremely difficult because words have different meanings an all depends on the context. For the right answer, Watson had to understand the context.
Variability is often confused with variety. Say you have bakery that sells 10 different breads. That is variety. Now imagine you go to that bakery three days in a row and every day you buy the same type of bread but each day it tastes and smells different. That is variability.
Variability is thus very relevant in performing sentiment analyses. Variability means that the meaning is changing (rapidly). In (almost) the same tweets a word can have a totally different meaning. In order to perform a proper sentiment analyses, algorithms need to be able to understand the context and be able to decipher the exact meaning of a word in that context. This is still very difficult.
Visualization
This is the hard part of big data. Making all that vast amount of data comprehensible in a manner that is easy to understand and read. With the right analyses and visualizations, raw data can be put to use otherwise raw data remains essentially useless. Visualizations of course do not mean ordinary graphs or pie charts. They mean complex graphs that can include many variables of data while still remaining understandable and readable.
Visualizing might not be the most technological difficult part; it sure is the most challenging part. Telling a complex story in a graph is very difficult but also extremely crucial. Luckily there are more and more big data startups appearing that focus on this aspect and in the end, visualizations will make the difference. One of them is future this will be the direction to go, where visualizations help organisations answer questions they did not know to ask.
Value
All that available data will create a lot of value for organisations, societies and consumers. Big data means big business and every industry will reap the benefits from big data. McKinsey states that potential annual value of big data to the US Health Care is $ 300 billion, more than double the total annual health care spending of Spain. They also mention that big data has a potential annual value of € 250 billion to the Europe’s public sector administration. Even more, in their well-regarded report from 2011, they state that the potential annual consumer surplus from using personal location data globally can be up to $ 600 billion in 2020. That is a lot of value.
Of course, data in itself is not valuable at all. The value is in the analyses done on that data and how the data is turned into information and eventually turning it into knowledge. The value is in how organisations will use that data and turn their organisation into an information-centric company that relies on insights derived from data analyses for their decision-making.

Dr Mark van Rijmenam
Dr. Mark van Rijmenam, widely known as The Digital Speaker, isn’t just a #1-ranked global futurist; he’s an Architect of Tomorrow who fuses visionary ideas with real-world ROI. As a global keynote speaker, Global Speaking Fellow, recognized Global Guru Futurist, and 5-time author, he ignites Fortune 500 leaders and governments worldwide to harness emerging tech for tangible growth.
Recognized by Salesforce as one of 16 must-know AI influencers , Dr. Mark brings a balanced, optimistic-dystopian edge to his insights—pushing boundaries without losing sight of ethical innovation. From pioneering the use of a digital twin to spearheading his next-gen media platform Futurwise, he doesn’t just talk about AI and the future—he lives it, inspiring audiences to take bold action. You can reach his digital twin via WhatsApp at: +1 (830) 463-6967.