Why Data Visualizations Provides You a Competitive Edge
Why Data Visualizations Provides You a Competitive Edge
The era of simple bar graphs and pie charts is over. Big Data requires a different approach to visualizations; one that will significantly impact your organisation’s bottom-line if carried out correctly. Companies that have become data-driven and information-centric understand this. They have made visualizations of large data sets an integral part of their decision making. Visual data analytics goes beyond standard reporting and is all about rich interactive visualizations where anyone can explore data and discover new insights. Proper data visualizations are all about exploring, deducing and discovering data in an intuitive way.
However, this is not yet a standard approach. Many companies are still using old ‘Business Intelligence’ using Excel sheets, pie charts and simple graphs, while rich infographics actually have appeared already for over 150 years. Already back in 1856, Florence Nightingale, the first female member of the Royal Statistical Society, developed an intriguing infographic to showcase data about dying soldiers in a compelling and convincing manner using a polar area diagram.
Visualizations like these infographics or rich data visualization as done for example by Tableau Software, Zoomdata or Roambi offer a lot of advantages for users. With the right visualizations you can actually tell a story that is far more convincing than data in tables or using simple graphs. In a single overview you can show vast amounts of data points that offers an overview and insights that normally would be impossible to derive from the data.
More and more data journalists are also taking this approach. They use great visualizations to tell a story. Especially The Guardian, The Economist or the Wall Street Journal are known for such articles, as well as the website FiverThirtyEight. They offer rich interactive visualizations that allow anyone to explore data and gain new insights. Another examples is Tableau Public, a service by Tableau Software Public, to bring the power of visualizing (public) data to anyone. Millions of people have already used this service and have made visualization with data from housing-, transportation-, social-, weather-, health- or culture datasets.
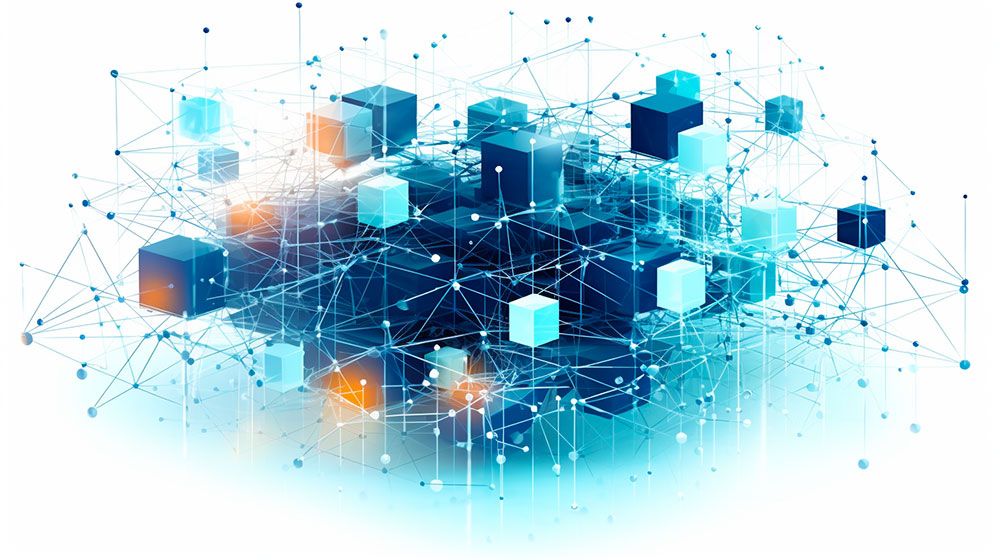
Data Visualizations
However, “with great visualizations comes great responsibility” as told by Tim Harford, an English economist and journalist, at the Tableau Software World tour in London that I was invited to last week. Because as information can be beautiful, misinformation can also be beautiful and as such these visualizations can easily (deliberately) deceive you. During his keynote, Tim told us that visualizations should convey a correct message, but most of the time they are confusing in what they are trying to convey, convey an incorrect message or incorporate subtle messages. According to Harford, data visualizations can sometimes be like dazzle camouflage as they can be used to lie to us or manipulate us and we should be aware of this.
However, when done correctly, data visualizations can tell great stories. Tableau Software understands how to tackle data visualizations at a large scale. During the Tableau Software Conference in London, which took place from July 7-9, they presented their latest version, Tableau 8.2, and shared their vision regarding data visualizations. Although still a young company, they were founded in 2001, they are working hard to bring interactive data visualizations in an easy-to-understand way to anyone. In order to achieve this, they have determined six key areas to focus on in the coming years:
1) Seamless Access to Data
Tableau wants to make it as easy as possible to connect the data. Their objective is to make analyzing the data easy and give fast responsiveness from the data for new insights.
2) Visual analytics for everyone
Once the data is connected, it is all about asking the right questions. Visualizing the data can provide you with new questions that need to be answered. Tableau therefore keeps adding new, innovative, visualizations (for example extensive mapping capabilities) to help its users with asking the right questions.
3) Analytics Everywhere
Accessing data everywhere and at any moment. More organizations require access and insights on-the-go and Tableau is working on drag and drop functionality on tablets and mobiles. They are becoming a direct competitor with Roambi, because they are making mobile visualizations as easy as possible to use on each mobile device.
4) Storytelling
In the latest release of Tableau Software, they have included story points to stimulate story telling using visualizations. Moving from static data presentations to dynamic data stories. This allows users to interact with the data during a presentation, without leaving the presentation.
5) Enterprise
Tableau continues to develop new features to support enterprise. These need to be secure, easily available, scalable and easy to integrate.
6) Fast, easy and beautiful
The objective of Tableau is to build software that allows such easy interaction with the data, resulting that the software fades away and users can focus on the data.
From a technical perspective Tableau is rapidly developing new value. Currently they support three platforms: Desktop, Server and Public. For instance given the increasing popularity of the Mac, support was added to Tableau Desktop. Fortunately instead of ‘porting’ the application to the new platform, they’ve separated the frontend from the backend. Then the backend was updated in order to run on both the Windows and Mac platforms. Therefore the only difference between the implementations is the custom frontend. A remarkable achievement.
This instantly makes Tableau for the Mac a feature complete application, except for some Windows specific connectors.
The new Tableau Server now features a REST API admin interface, which is Enterprise ready (think about security for instance). The API allows you to administer your entire Tableau cluster. Interesting detail: Tableau uses all their own products themselves, hence every application is being extensively tested before going into production. When time comes to upgrade your server and enjoy the new features, it is good to know that the upgrade should be an easy one. Tableau completely separates your data and meta-data from the actual applications, making painful migrations a think of the past.
When you make decisions using rich, interactive, visualization, you are far better off than making decision without data or with simple visualizations. This will definitely put you at an advantage compared to your competitors. Tableau Software is working hard to develop a solution that provides these insights from vast amounts of data in an easy to understand manner, giving you a competitive edge.
Image source: Vizbi
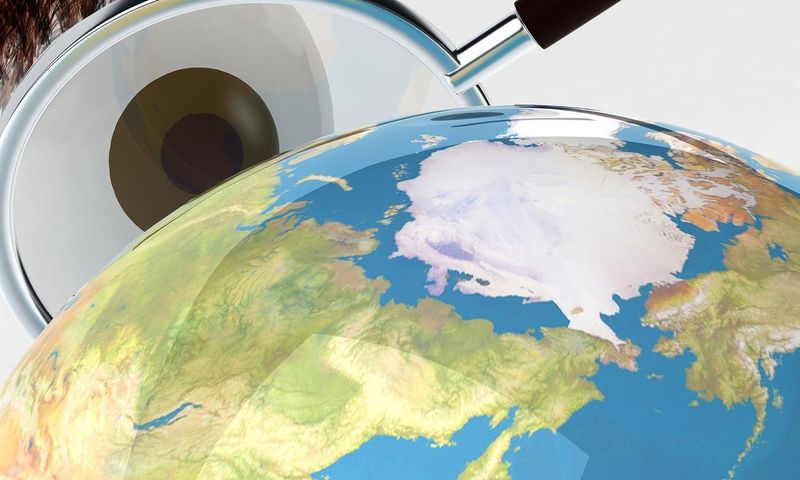
Image Credit: pulsar011/Shutterstock

Dr Mark van Rijmenam
Dr. Mark van Rijmenam, widely known as The Digital Speaker, isn’t just a #1-ranked global futurist; he’s an Architect of Tomorrow who fuses visionary ideas with real-world ROI. As a global keynote speaker, Global Speaking Fellow, recognized Global Guru Futurist, and 5-time author, he ignites Fortune 500 leaders and governments worldwide to harness emerging tech for tangible growth.
Recognized by Salesforce as one of 16 must-know AI influencers , Dr. Mark brings a balanced, optimistic-dystopian edge to his insights—pushing boundaries without losing sight of ethical innovation. From pioneering the use of a digital twin to spearheading his next-gen media platform Futurwise, he doesn’t just talk about AI and the future—he lives it, inspiring audiences to take bold action. You can reach his digital twin via WhatsApp at: +1 (830) 463-6967.
